
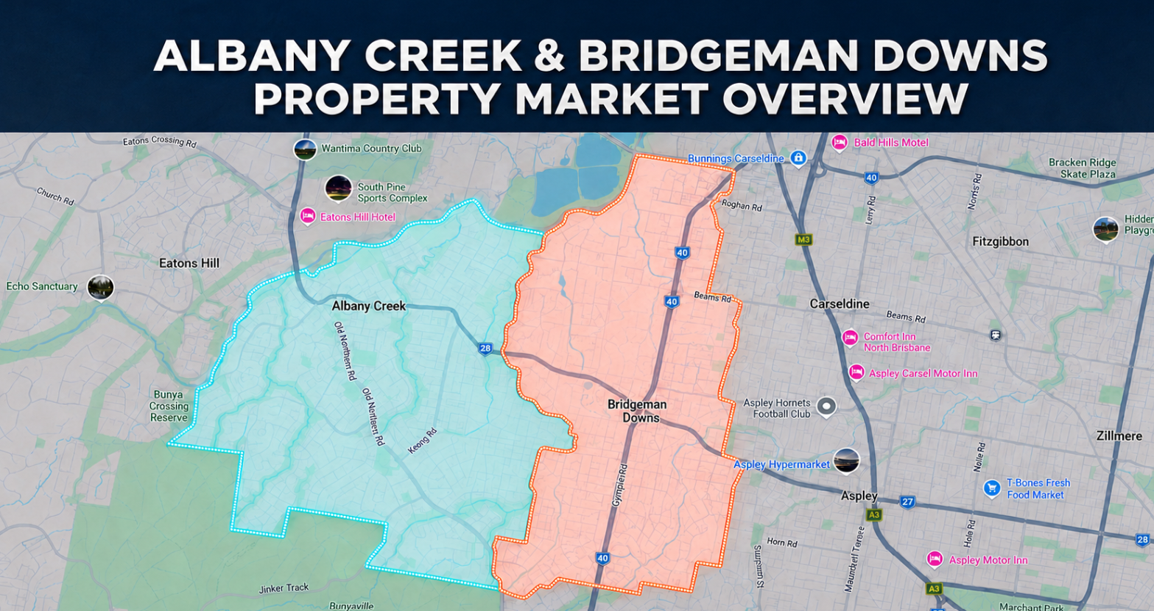

Albany Creek & Bridgeman Downs Property Market Overview
Albany Creek & Bridgeman Downs Market Overview
3 months vs 12 months to 23 July 2026
At a Glance
| Suburb | 3‑Month House Median | 12‑Month House Median | 3‑Month Sales | Median Days to Sell |
|---|---|---|---|---|
| Bridgeman Downs | $1,662,500 | $1,641,000 | 27 | 15 days |
| Albany Creek | $1,470,000 | $1,310,000 | 30 | 15 days |
Monthly Median House Price — Trailing 12 Months
Median Price by Bedroom Count — Houses
3-month window compared with the trailing 12-month benchmark. No 3-bed houses sold in Bridgeman Downs this quarter.
| Bedrooms | 3-Month Sales | 3-Month Median | 12-Month Sales | 12-Month Median |
|---|---|---|---|---|
| 3-bed | — | — | 6 | $1,291,500 |
| 4-bed | 10 | $1,600,000 | 65 | $1,550,000 |
| 5-bed | 6 | $1,925,000 | 50 | $1,753,000 |
Vacant Land — Separate from House Medians
A steady run of new house-and-land sales, mostly around Missouri Crescent, Constance Place and Quaver Court/Crt — kept out of the house figures above.
| Window | Sales | Median | Block Size Range |
|---|---|---|---|
| 3-Month | 2 | $854,500 | 400–444m² |
| 12-Month | 74 | $975,000 | 400–1,000m² |
Top 10 Sales — Trailing 3 Months
Highest confirmed sale prices, 24 April – 23 July 2026.
Agent Leaderboard — Trailing 3 Months
| Agent | Sales |
|---|
Monthly Median House Price — Trailing 12 Months
Median Price by Bedroom Count — Houses
3-month window compared with the trailing 12-month benchmark.
| Bedrooms | 3-Month Sales | 3-Month Median | 12-Month Sales | 12-Month Median |
|---|---|---|---|---|
| 3-bed | 8 | $1,085,000 | 61 | $1,150,000 |
| 4-bed | 10 | $1,515,000 | 75 | $1,350,000 |
| 5-bed | 3 | $1,827,500 | 23 | $1,602,000 |
Top 10 Sales — Trailing 3 Months
Highest confirmed sale prices, 24 April – 23 July 2026.
Agent Leaderboard — Trailing 3 Months
| Agent | Sales |
|---|
This overview is intended as a general market summary only and is provided for informational purposes. Nothing on this page constitutes financial, investment, legal or real estate advice. All figures, medians, rankings, and market observations are indicative only and should not be relied upon as complete or definitive. Property markets are dynamic and conditions can change rapidly — past performance is not a reliable indicator of future results. Readers should conduct their own independent research and seek qualified professional advice before making any property decision.
This overview is based on publicly available property transaction data for the periods stated in the above sections. All data is presented in aggregated and derived form. All dates are settlement dates. Where prices are unavailable, those transactions may be included in sales counts but are excluded from median and price band calculations. © 2026.
