
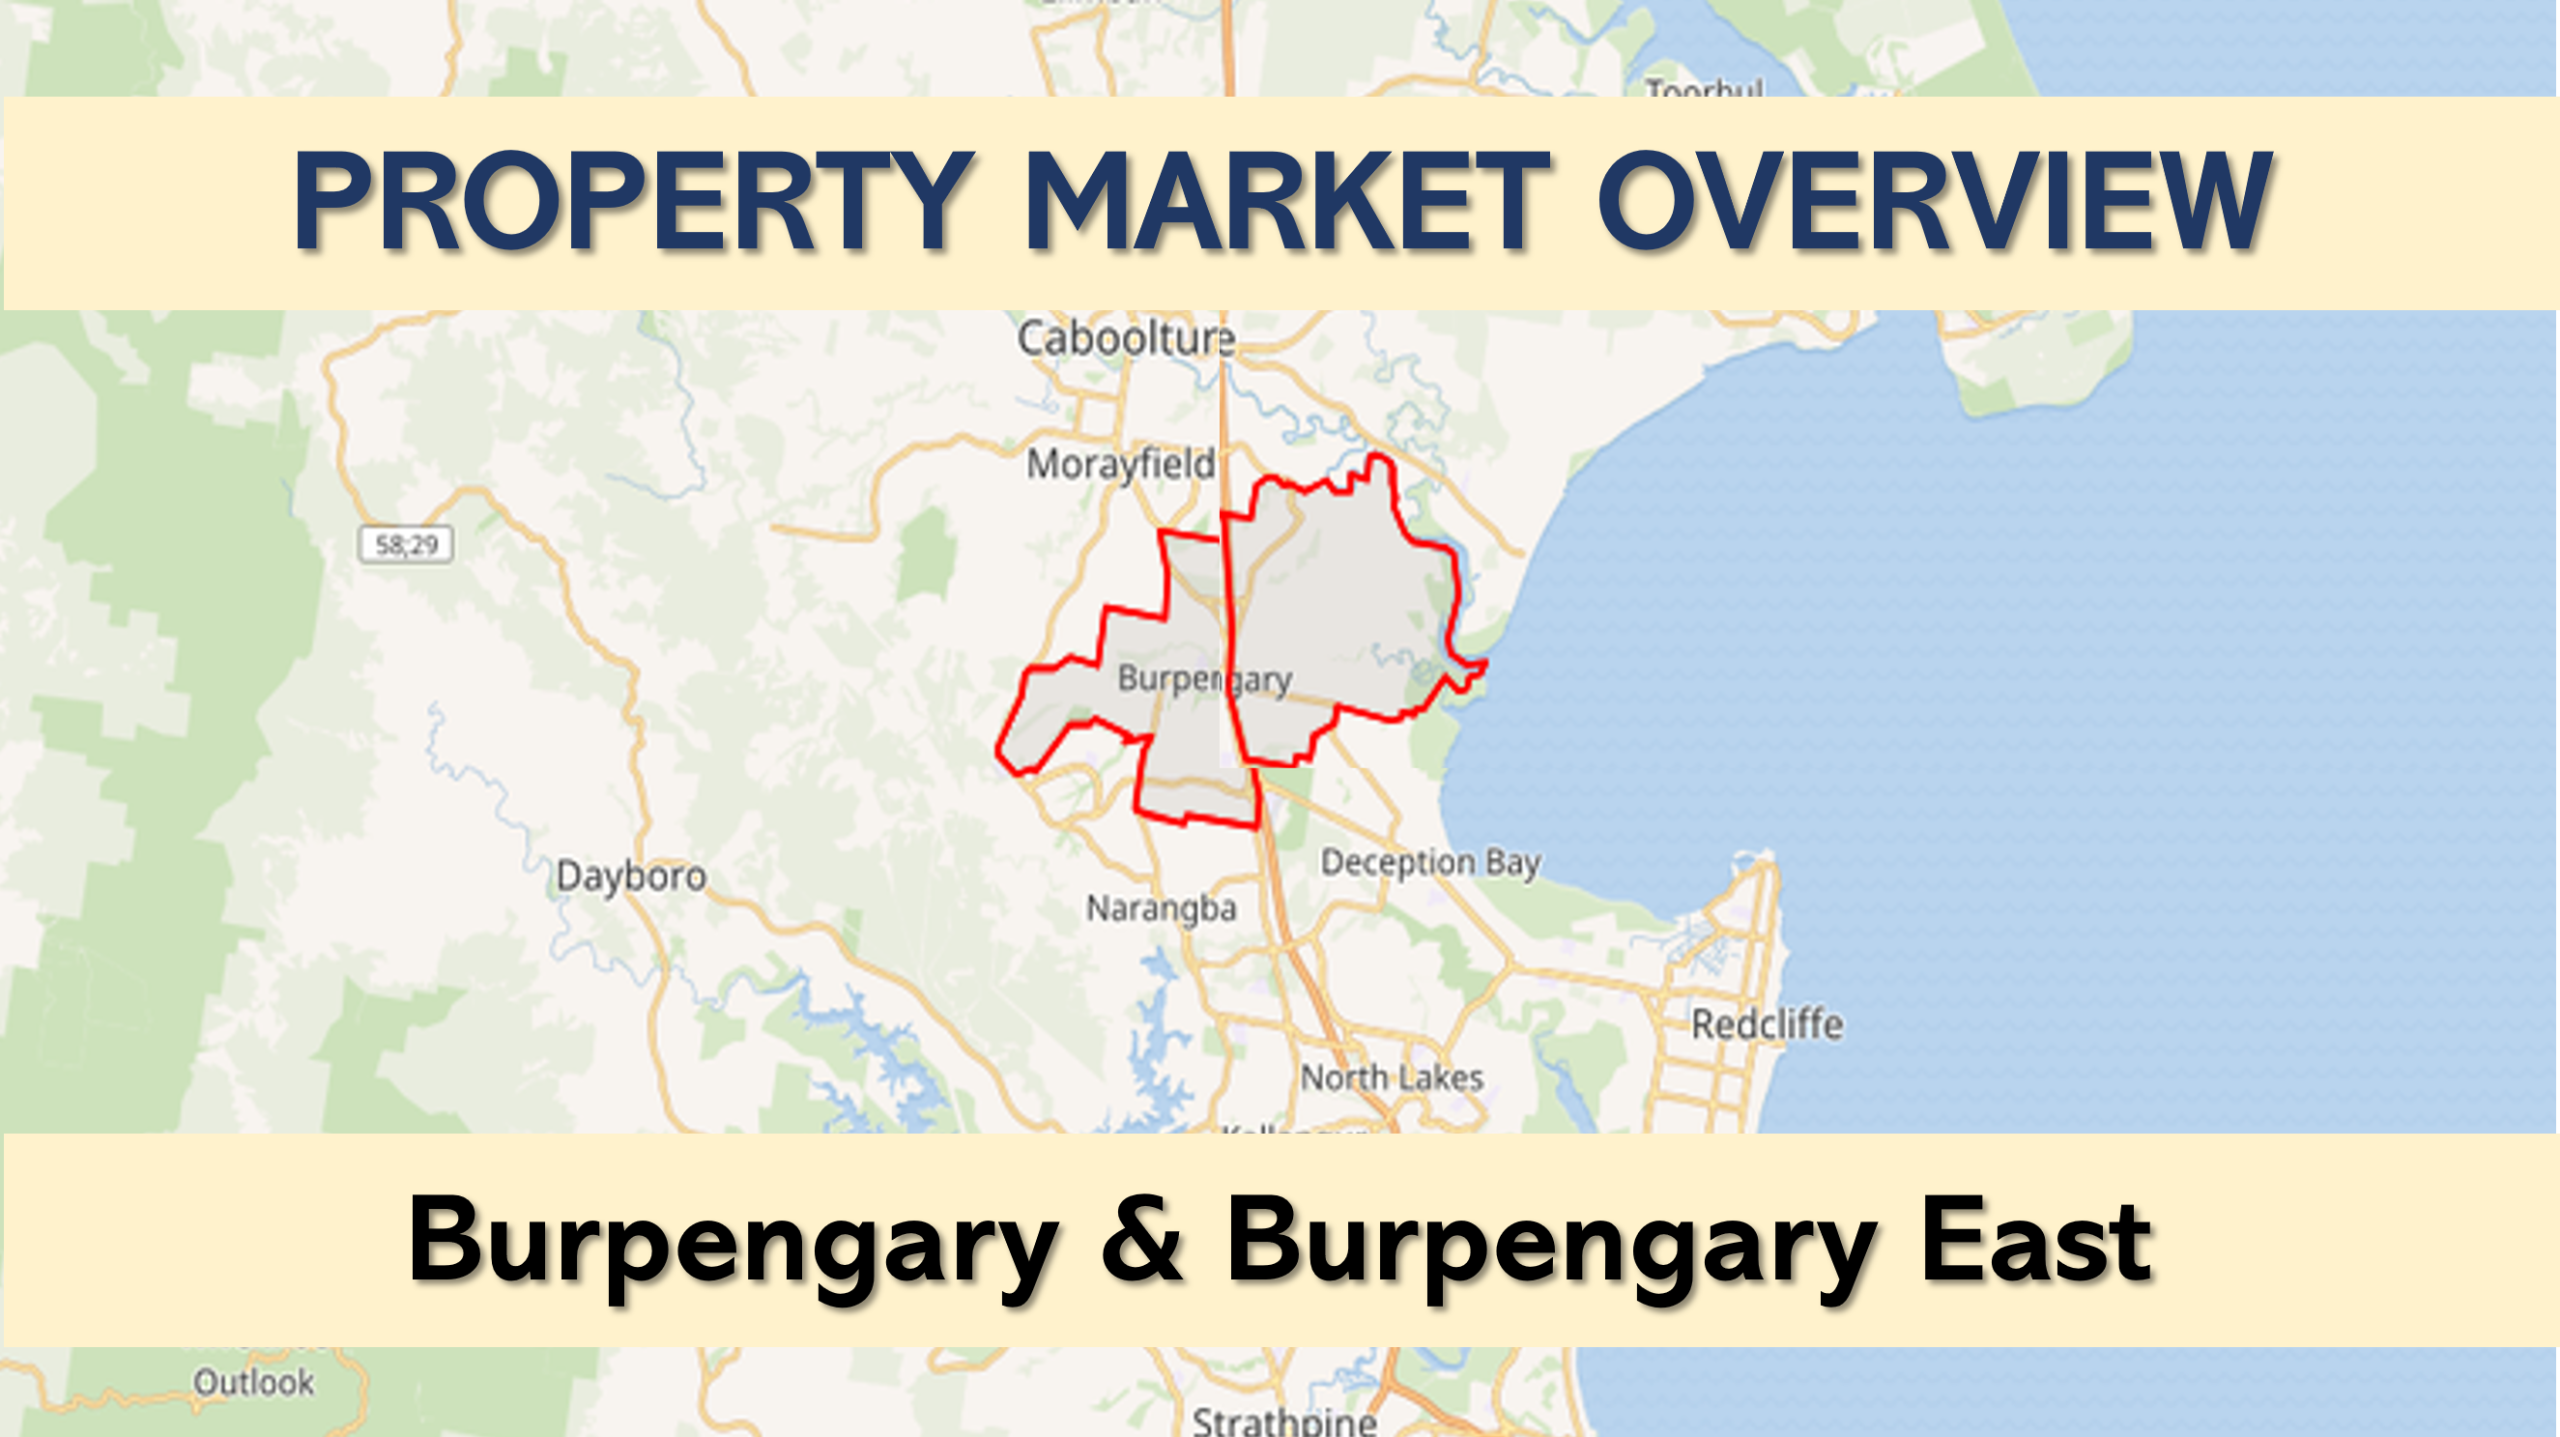

Burpengary & Burpengary East Property Market Overview
Property Market Overview · Moreton Bay
Burpengary & Burpengary East
Three months and 12 months to 18 October 2026 · Published 19 October 2026
At a Glance
Jump to: Burpengary · Burpengary East
| Suburb | House median (vs 12‑month median) | Townhouse & unit median | Homes sold | Days to sell (houses) | Main type of home |
|---|---|---|---|---|---|
| Burpengary | $945,000 (−2.7%) | $682,500 (−1.5%) | 64 | 27 | Houses |
| Burpengary East | $1,010,000 (−8.1%) | Only a handful sold | 47 | 41 | Houses |
Latest three months. Homes sold includes acreage homes.
How This Report Reads the Market
Each suburb's results for the latest three months (19 July – 18 October 2026) are compared with the past 12 months. This shows the market's current direction: whether recent sales are running ahead of, in line with, or behind the pace of the past year.
Prices are medians: the middle sale price when all sales are lined up from lowest to highest. House prices cover homes on blocks up to 4,000 m²; acreage homes are shown separately.
Headlines vs the Local Numbers
The local sales figures show a softer recent three-month median than the 12-month median in both suburbs. These are comparisons of different sale samples, not evidence that individual homes have fallen in value. The mix of properties sold, particularly block sizes, can influence the median.
Burpengary 4505
Burpengary: House Prices a Little Below the 12‑month Median, and Taking Longer to Sell
The median house price for Burpengary was $945,000 over the past three months, 2.7% below the 12‑month median of $971,000. Houses are taking longer to sell, with a median of 27 days compared with 15 days over the past 12 months.
Key Market Indicators — Trailing 3 Months
- Close to the 12‑month median. The median house price of $945,000 sits 2.7% below the 12‑month median of $971,000.
- Recent sales mix. The three-month house median is $945,000, below the 12-month median of $971,000. Monthly medians fluctuate and should not be treated as a continuous price index.
- Slower sales. Houses took a median of 27 days to sell, up from 15 days over the past 12 months.
Burpengary Price Trend
The three-month median is $945,000. The monthly medians below show variability in the mix of homes sold; they are not a like-for-like price index.
Show monthly figures
| Month | Median house price |
|---|---|
| Oct 25 | $1,050,000 |
| Nov 25 | $930,000 |
| Dec 25 | $990,000 |
| Jan 26 | $900,000 |
| Feb 26 | $975,000 |
| Mar 26 | $1,020,000 |
| Apr 26 | $965,000 |
| May 26 | $985,000 |
| Jun 26 | $1,090,000 |
| Jul 26 | $1,065,000 |
| Aug 26 | $930,000 |
| Sep 26 | $932,500 |
Burpengary Homes Are Taking Longer to Sell
Houses in Burpengary took a median of 27 days to sell over the past three months, up from 15 days over the past 12 months. 41% took a month or longer, compared with 29% over the past 12 months.
Show the figures
| Time to sell | Past 3 months | Past 12 months |
|---|---|---|
| Under 30 days | 59% | 71% |
| 30–59 days | 11% | 12% |
| 60–89 days | 22% | 9% |
| 90+ days | 8% | 8% |
Burpengary House Prices by Bedrooms
Four-bedroom houses made up the largest share of sales over the past three months, with a median of $961,000.
| Bedrooms | Sold (last 3 months) | Median, last 3 months | Median, past 12 months |
|---|---|---|---|
| 3 | 10 | $875,000 † | $897,000 |
| 4 | 25 | $961,000 | $977,500 |
| 5 | 7 | $1,100,000 † | $1,210,000 |
Houses on blocks up to 4,000 m². † Based on fewer than 10 sales. — Too few sales to show a median.
Burpengary Townhouses & Units and Acreage
The median townhouse and unit price in Burpengary was $682,500 over the past three months, 1.5% below the 12‑month median of $693,000.
Four acreage homes (blocks over 4,000 m²) sold in Burpengary over the past three months, between $1,250,000 and $2,800,000. The 12‑month median for acreage homes is $1,417,500.
Burpengary Top 10 Sales
| Address | Bed | Bath | Price | Agent |
|---|---|---|---|---|
| 84 Gleeson Rd | 3 | 1 | $2,800,000 | — |
| 8 Osborne Dr | 4 | 2 | $1,700,000 | Rheanna Burdon |
| 55-59 Canopy Pl | 5 | 3 | $1,600,000 | Liam Booker |
| 85-87 Rosehill Dr | 4 | 2 | $1,350,000 | James Chippendale |
| 108 Coutts Dr | 3 | 1 | $1,300,000 | Tyson Von Hoff |
| 46-48 Chestnut Dr | 5 | 2 | $1,284,000 | Kindred Sales |
| 33 Hawthorn Rd | 4 | 2 | $1,250,000 | — |
| 3 Copland Ct | 4 | 2 | $1,150,000 | Gavin Lomas |
| 1 Bandt Cl | 5 | 2 | $1,138,119 | Sia Saeedifar |
| 153 Pitt Rd | 4 | 2 | $1,120,000 | Brooke Hawthorne |
Burpengary East 4505
Burpengary East: a Lower Recent Median and Longer Selling Times
The median house price for Burpengary East was $1,010,000 over the past three months, 8.1% below the 12‑month median of $1,099,500. Houses are taking longer to sell, with a median of 41 days compared with 20 days over the past 12 months.
Key Market Indicators — Trailing 3 Months
- Below the 12‑month median. The overall median house price of $1,010,000 sits 8.1% below the 12‑month median of $1,099,500.
- Sales mix matters. For houses on blocks under 1,000 m², the supplied median of $972,500 is close to the 12-month figure of $990,000; this is not a matched-property comparison.
- Slower sales. Houses took a median of 41 days to sell, up from 20 days over the past 12 months.
Burpengary East Price Trend
The monthly median house price has ranged from $978,000 to $1,305,000 over the past year, moving with the mix of block sizes sold.
Show monthly figures
| Month | Median house price |
|---|---|
| Oct 25 | $1,080,000 |
| Nov 25 | $1,305,000 |
| Dec 25 | $1,200,000 |
| Jan 26 | $1,292,500 |
| Feb 26 | $1,138,000 |
| Mar 26 | $1,039,500 |
| Apr 26 | $1,025,000 |
| May 26 | $1,220,000 |
| Jun 26 | $1,220,000 |
| Jul 26 | $1,250,000 |
| Aug 26 | $978,000 |
| Sep 26 | $1,087,000 |
Burpengary East Homes Are Taking Longer to Sell
Houses in Burpengary East took a median of 41 days to sell over the past three months, up from 20 days over the past 12 months. 66% took a month or longer, compared with 37% over the past 12 months.
Show the figures
| Time to sell | Past 3 months | Past 12 months |
|---|---|---|
| Under 30 days | 34% | 63% |
| 30–59 days | 38% | 23% |
| 60–89 days | 12% | 5% |
| 90+ days | 16% | 9% |
Burpengary East House Prices by Bedrooms
Four-bedroom houses made up the largest share of sales over the past three months, with a median of $1,020,000.
| Bedrooms | Sold (last 3 months) | Median, last 3 months | Median, past 12 months |
|---|---|---|---|
| 3 | 4 | — | $940,000 |
| 4 | 27 | $1,020,000 | $1,099,000 |
| 5 | 4 | — | $1,500,000 |
| 6 | 2 | — | $1,700,000 † |
Houses on blocks up to 4,000 m². † Based on fewer than 10 sales. — Too few sales to show a median.
Burpengary East Townhouses & Units and Acreage
Two townhouses and units sold in Burpengary East over the past three months, at $680,000 and $690,000, against a 12‑month median of $659,000.
Five acreage homes (blocks over 4,000 m²) sold in Burpengary East over the past three months, between $905,000 and $2,000,000. The 12‑month median for acreage homes is $1,600,000.
Burpengary East Top 10 Sales
| Address | Bed | Bath | Price | Agent |
|---|---|---|---|---|
| 119 Cobb Rd | 6 | 3 | $2,350,000 | Chris Bowmaker |
| 24 Margaret St | 5 | 4 | $2,000,000 | Mark Cheney |
| 69 Northwood Dr | 4 | 3 | $1,944,100 | — |
| 2 Pincushion Lane | 4 | 2 | $1,918,300 | — |
| 283 Uhlmann Rd | 4 | 2 | $1,850,000 | Jack Carr |
| 35 Roseberry Pl | 4 | 3 | $1,725,000 | Jasmine Ward |
| 198 Coach Road East | 4 | 3 | $1,550,000 | Jack Carr |
| 76 Fraser Dr | 5 | 5 | $1,500,000 | David Huynh |
| 63 Brook Cres | — | — | $1,420,000 | — |
| 50 Moore Rd | 6 | 3 | $1,350,000 | Cara Bergmann |
Property Market Overview | Burpengary & Burpengary East | Published 19 October 2026
Disclaimer
Published 19 October 2026
This overview is intended as a general market summary only and is provided for informational purposes. Nothing on this page constitutes financial, investment, legal or real estate advice. All figures, medians, rankings, and market observations are indicative only and should not be relied upon as complete or definitive. Property markets are dynamic and conditions can change rapidly — past performance is not a reliable indicator of future results. Readers should conduct their own independent research and seek qualified professional advice before making any property decision.
This overview is based on publicly available property transaction data for the periods stated above. All data is presented in aggregate and derived form. Reporting periods are based on settlement dates where available. Where confirmed settlement dates are unavailable, estimated settlement dates may be used based on available transaction information and standard settlement assumptions. These estimates may affect the allocation of transactions to reporting periods and the resulting market statistics. Where sale prices are unavailable, those transactions may be included in sales counts but are excluded from median and price band calculations.
© 2026.
