Comparing the Current Velocity of the Albany Creek and Bridgeman Downs Property Market
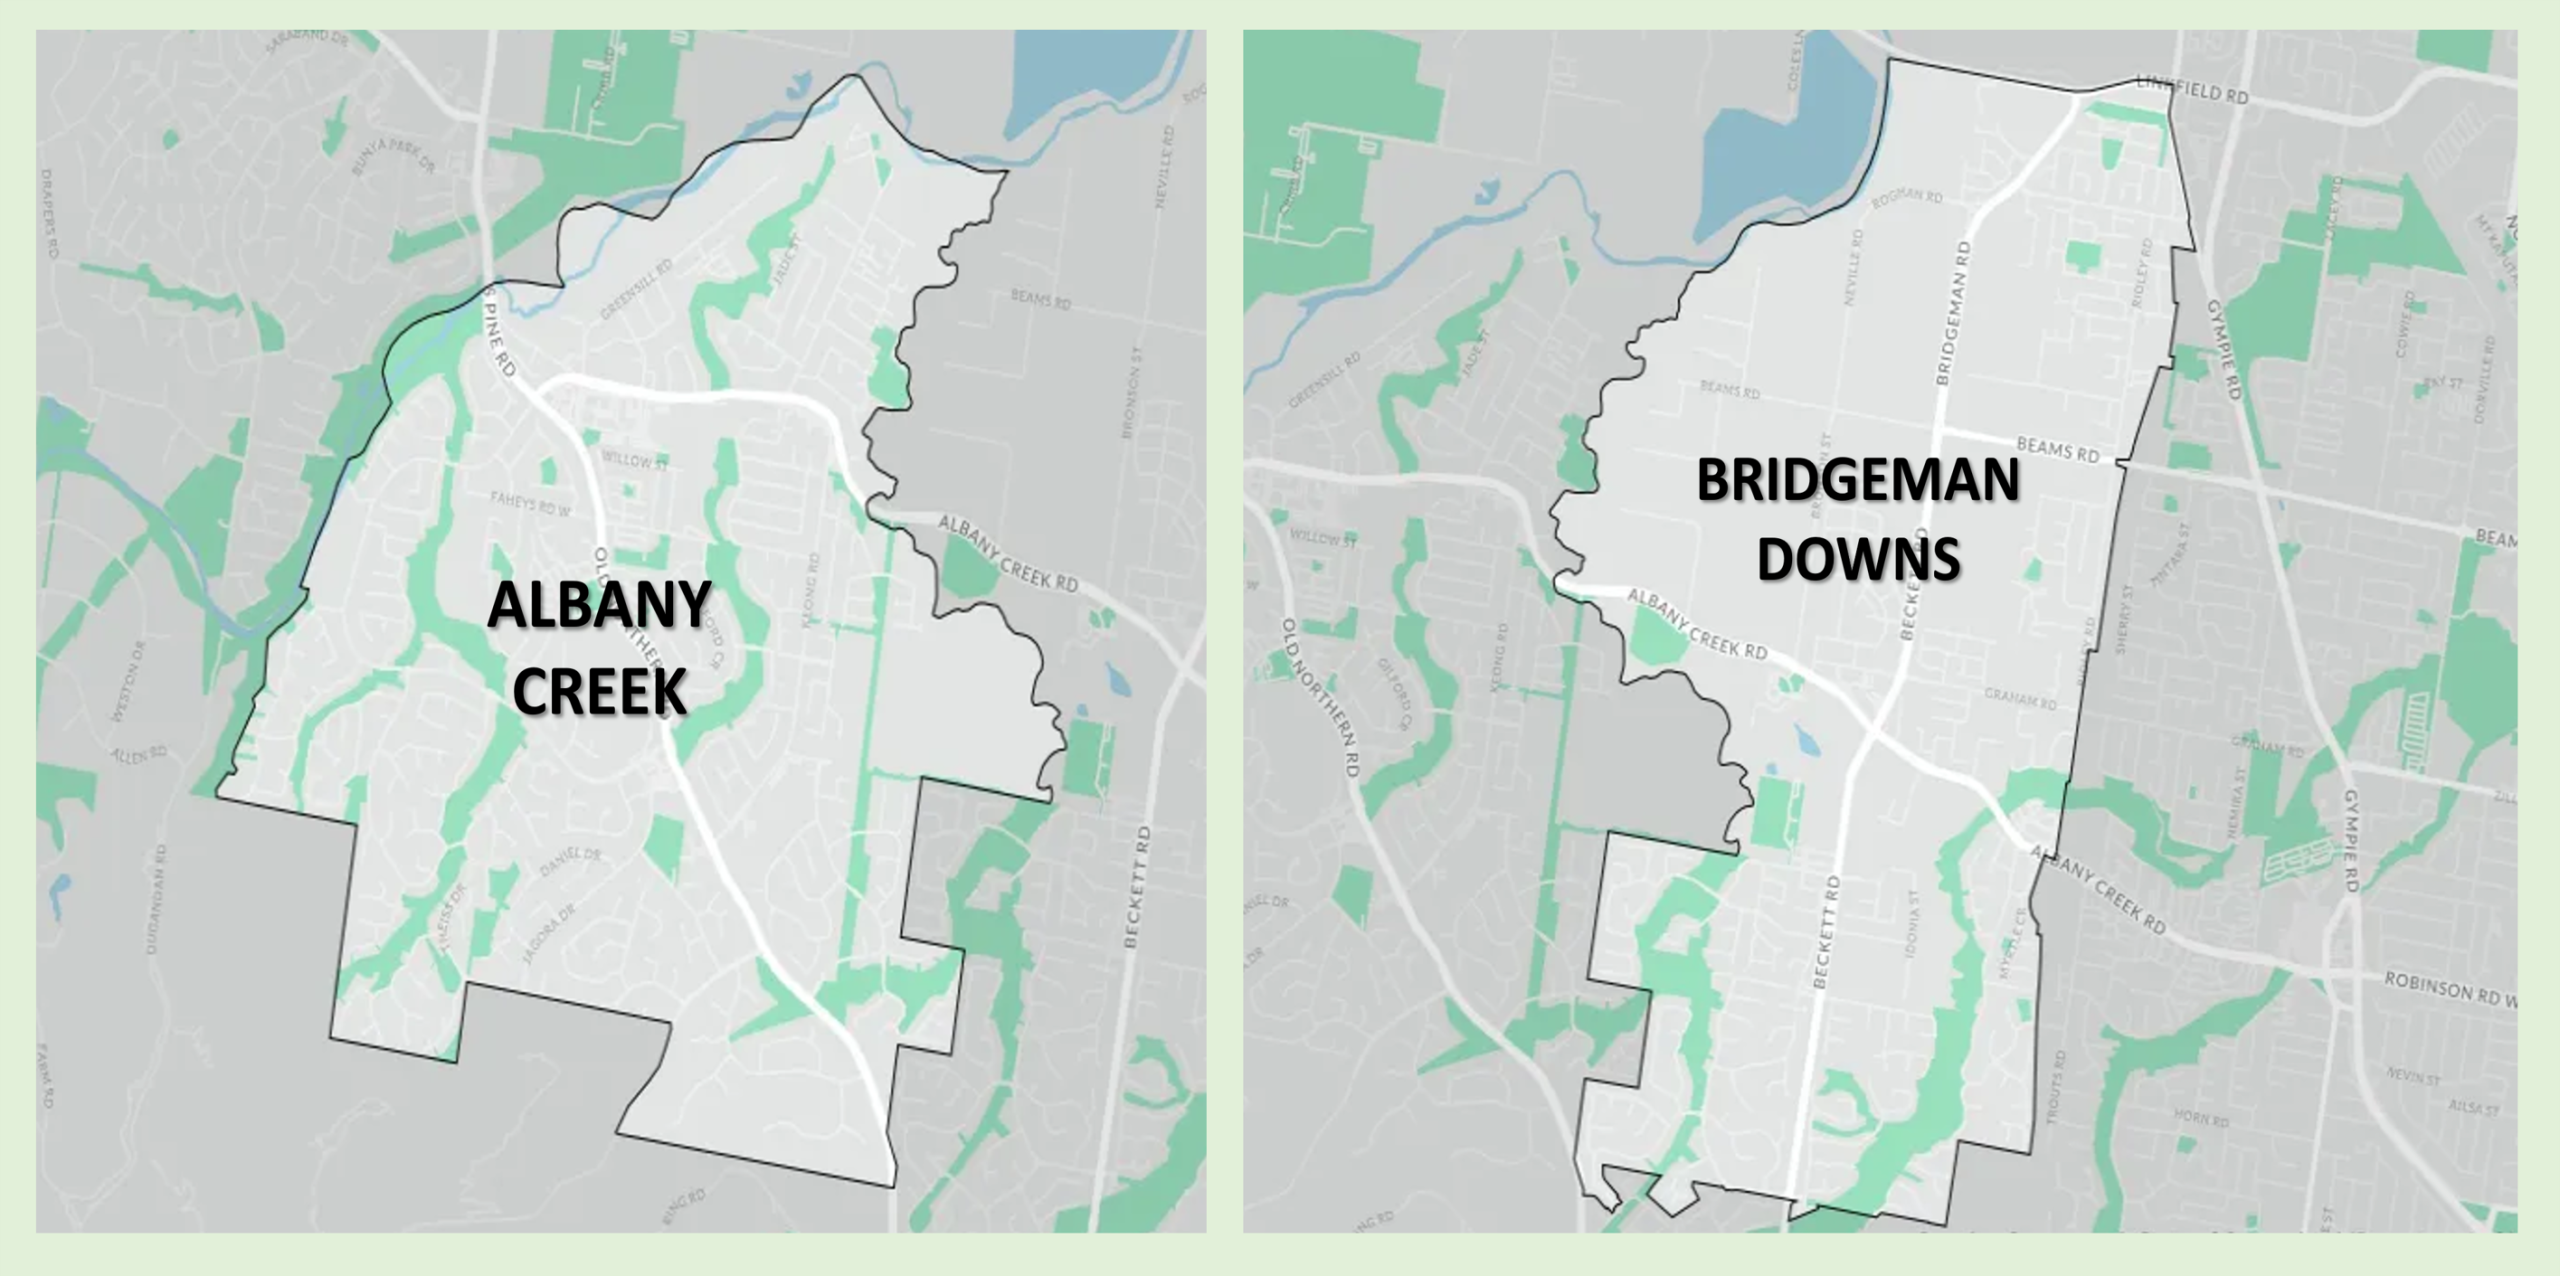
Albany Creek and Bridgeman Downs sit side by side on Moreton Bay’s southside and Brisbane’s northside, yet they tell distinctly different stories about where the market is heading.
Albany Creek is the higher-volume, more accessible of the two — 296 annual sales across a broad mix of houses, townhouses and units, with a 90-day median of $1,235,000 that sits 13.6% above the 12-month benchmark. It is a market in active upward movement, with 3-bedroom and 5-bedroom houses both recording double-digit gains against the annual median. With a top-5 agent share of just 46.3%, it is also one of the most competitive and open markets on the northside — vendors have genuine choice.
Bridgeman Downs is a different proposition entirely. Tighter, more premium, and more concentrated — 180 annual sales, a 90-day median of $1,655,000, and a market defined almost entirely by 4 and 5-bedroom family homes in the $1.5M–$2M corridor. The 4-bedroom house segment is its standout story, running +12.7% above the annual median.
Bridgeman Downs has a two-agent market at its core. Sonya Treloar and Ben Ball together account for 49% of all transactions.
Sonya is well established and Ben runs the fastest growing agency in the area, currently handling a number of high-end listings.
The top 6 agents collectively hold 71.8% of the market, reflecting a suburb where established local specialists with deep buyer databases consistently dominate.
Between them, the two suburbs transacted over $135 million worth of residential property in just 90 days — a figure that underscores the enduring strength of Brisbane’s northside as a destination for families, upsizers and long-term investors alike.
Albany CreekProperty Market Overview
90-Day Market Snapshot · January – April 2026 · Benchmarked against 12-Month Medians
Market at a Glance
Albany Creek’s 90-day median of $1,235,000 sits 13.6% above the 12-month benchmark — with 3-bedroom and 5-bedroom houses both recording double-digit gains, signalling a market in active upward movement.
Median Prices & Market Velocity
Comparing 90-day medians against the full 12-month benchmark. Arrows indicate movement vs. the annual median.
Broad-based house momentum: Three of four house segments are running ahead of the annual median — and the two leading segments (3BR +13.9%, 5BR +14.0%) are backed by 14 and 6 sales respectively, giving these results genuine statistical weight. The 4BR market, Albany Creek’s most liquid tier with 81 annual sales, is stable at +1.7%.
Price Band Distribution
Sales by Price Range · 90 Days
Albany Creek has a well-distributed market across all price tiers — no single band dominates excessively, with activity spread from $750K through to $1.85M. This reflects the suburb’s diverse housing mix: quality townhouses and villas in the sub-$1M range, family homes through the $1M–$1.5M core, and larger prestige homes at the upper end.
The 90-day median of $1,235,000 sits well above the 12-month median of $1,087,000 — Albany Creek’s strongest positive velocity reading in recent periods.
Top 10 Sales · Last 90 Days
| # | Address | Type | Agent | Sale Price |
|---|---|---|---|---|
| 1 |
24 Lancewood Dr |
5BR House | Wayne CornellLJ Hooker Property Connections | $1,850,000 |
| 2 |
22 Mahogany Dr |
5BR House | James GwynnePlace – Albany Creek | $1,825,000 |
| 3 |
16 Turnberry Cres |
5BR House | Peter RobertsonPosition Property | $1,801,000 |
| 4 |
25 Biggs Ct |
6BR House | Sia SaeedifarSET | $1,800,000 |
| 5 |
14 Saint Andrews Crt |
5BR House | Cara BergmannCara Bergmann Properties | $1,755,000 |
| 6 |
5 Lytham Crt |
4BR House | Justin WattWatt Realty | $1,631,000 |
| 7 |
43 Gleneagles Cres |
4BR House | Bianca ReynoldsNiew Property | $1,630,000 |
| 8 |
17 Oakmont Cres |
5BR House | Felicity AustinGlynis Austin Properties | $1,602,000 |
| 9 |
5 Kosta Pl |
4BR House | Cara BergmannCara Bergmann Properties | $1,592,500 |
| 10 |
4 Poona Crt |
4BR House | Cara BergmannCara Bergmann Properties | $1,582,500 |
Five-bedroom houses dominate the top end — four of the top five sales were 5BR homes, all clearing above $1.75M. The suburb’s top result of $1,850,000 at 24 Lancewood Drive confirms genuine buyer appetite for quality large-format family homes in Albany Creek’s most sought-after streets.
Agent Leaderboard · 90 Days
Albany Creek is a genuinely competitive market — with a top-5 share of 46.3%, no single agent dominates. Eight agents recorded 2 or more sales in the 90-day period across a diverse range of local and independent agencies, reflecting meaningful competition for every listing. Vendors have genuine choice.
By Sales Count
Top 5 · 46.3% combined market share
With the market this open, vendor outcomes are driven more by individual agent quality and marketing execution than by brand dominance. Track record in your specific price band — not total suburb volume — is the most reliable selection criterion here.
Market Summary
Albany Creek is recording its strongest 90-day performance relative to the annual median across this report series. A +13.6% premium over the 12-month benchmark reflects broad buyer demand across house sizes — with 3BR (+13.9%) and 5BR (+14.0%) houses both delivering standout results backed by meaningful transaction volumes.
The suburb’s appeal as a family destination on the northside — combining affordable entry-level stock with quality large-format family homes and excellent schooling — continues to underpin demand. At 296 annual sales, Albany Creek offers strong market depth and liquidity across all price tiers.
With a median of 16 days on market and 16% of properties selling within the first week, well-priced stock is moving with confidence.
Prices are running well ahead of what the annual median might suggest — particularly in the 3BR and 5BR segments. Buyers anchoring to 2025 benchmarks are finding themselves underbidding. Current market evidence should be the pricing guide, not historical data.
Strong conditions across all house sizes. The 90-day data supports pricing at or above the 12-month median in the 3BR and 5BR segments with confidence. A competitive agent field means presentation and marketing quality are critical differentiators.
At 296 annual sales, Albany Creek is one of the most liquid markets on the northside. The 4BR house segment — 81 sales over 12 months — provides the deepest and most consistent comparable base for investors seeking reliable capital growth evidence.
Bridgeman DownsProperty Market Overview
90-Day Market Snapshot · January – April 2026 · Benchmarked against 12-Month Medians
Market at a Glance
Bridgeman Downs is a premium house market — 90-day median of $1,655,000 sits +10.3% above the 12-month benchmark, with 4-bedroom houses leading at +12.7% and units significantly outperforming at +10.6%.
Median Prices & Market Velocity
Comparing 90-day medians against the full 12-month benchmark. Arrows indicate movement vs. the annual median.
The 4BR story: The 4-bedroom house segment is Bridgeman Downs’ most liquid tier — 16 sales in 90 days gives this median strong reliability. At +12.7% above the annual benchmark it is the clearest signal of genuine price appreciation in the suburb. The 5BR market is stable, tracking almost exactly in line with the annual median at just −0.2%.
Price Band Distribution
Sales by Price Range · 90 Days
* Includes 95 Tiverton Pl at $6,100,000 — see note below
Bridgeman Downs is a $1.5M–$2M heartland market — 65% of all sales settled in this single band. This remarkable concentration reflects the suburb’s consistent house stock: quality 4BR and 5BR family homes on generous lots that consistently attract buyers in this price corridor.
The 90-day median of $1,655,000 sits comfortably above the 12-month benchmark of $1,500,000 — a clear signal of buyer confidence and active competition for available stock.
Top 10 Sales · Last 90 Days
| # | Address | Type | Agent | Sale Price |
|---|---|---|---|---|
| 1 |
95 Tiverton Pl |
5BR House | Courtney Caulfield · Place Estate Agents | $6,100,000 * |
| 2 |
8 Splendid Dr |
4BR House | Ben Ball · Belle Property – Bridgeman Downs | $2,532,000 |
| 3 |
12 Asteroid Pl |
4BR House | Tom Kralikas · Place Brisbane City | $2,150,000 |
| 4 |
28 Knightsbridge Pl |
6BR House | Dan D’Silva · Sol Property | $2,025,000 |
| 5 |
12 Trequanda Pl |
6BR House | Sonya Treloar · Ray White – Bridgeman Downs | $1,916,000 |
| 6 |
39 Shuttle Pl |
5BR House | John Murray · McGrath Paddington | Price Undisclosed |
| 7 |
51 Goldberg Pl |
4BR House | Sonya Treloar · Ray White – Bridgeman Downs | $1,850,000 |
| 8 |
35 Levy Crct |
4BR House | Sonya Treloar · Ray White – Bridgeman Downs | $1,840,000 |
| 9 |
9 Polaris Pl |
4BR House | Nicholas Given · Ray White Clayfield | $1,830,000 |
| 10 |
30 Halleys Cres |
5BR House | Ben Ball · Belle Property – Bridgeman Downs | $1,805,000 |
* 95 Tiverton Place — $6,100,000: A standout prestige sale that significantly exceeds the suburb’s typical price range. Without this sale the next highest result is $2,532,000. The result confirms that Bridgeman Downs’ larger luxury homes attract genuine buyer depth at the top end of the Brisbane northside market.
Agent Leaderboard · 90 Days
Bridgeman Downs has a two-agent market at its core. Sonya Treloar and Ben Ball together account for 49% of all transactions — 19 of 39 sales between them. The top 6 agents collectively hold 71.8% of the market, reflecting a suburb where established local specialists with deep buyer databases consistently dominate.
By Sales Count
Top 6 · 71.8% combined market share
With 59% of the market controlled by just 5 agents — and two agents holding nearly half — vendor choice in Bridgeman Downs is a decision that materially affects outcomes. Local specialists consistently outperform on both price and time to sell.
Market Summary
Bridgeman Downs is performing strongly. The 90-day median of $1,655,000 sits +10.3% above the 12-month benchmark — driven principally by the 4-bedroom house segment, which at +12.7% above the annual median is the suburb’s most active and most improving tier.
With 37 priced sales in 90 days, Bridgeman Downs operates as a considered market — buyers here are making deliberate, researched decisions. The median of 15 days on market reflects genuine buyer appetite rather than rushed decision-making, and the suburb’s consistent $1.5M–$2M price corridor offers reliable comparable evidence for both vendors and purchasers.
The $6.1M sale at 95 Tiverton Place confirms that prestige demand exists at the very top end — a significant result for the northside Brisbane market.
The 4BR segment is moving faster than the annual median suggests. With 16 sales in 90 days and prices running +12.7% above the annual benchmark, buyers who anchor to last year’s prices are finding themselves behind the market.
Conditions strongly favour vendors in the 4BR category. The 90-day data validates pricing above the 12-month median — well-presented homes in the $1.6M–$1.9M range are finding ready buyers within a fortnight.
At 180 annual sales, Bridgeman Downs offers solid liquidity for a premium northside suburb. The 4BR house segment — 67 sales over 12 months — provides the deepest comparable base and the most consistent price growth signal.