The Truth About Coastal Erosion & Sea Walls in Margate
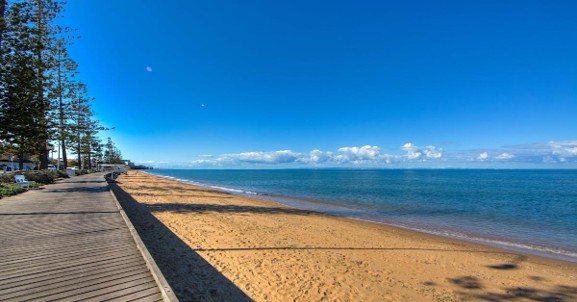
If you’ve stood along Margate’s foreshore during a king tide, you’ve seen the water sit higher than usual. Sand narrows. Park edges saturate. Photos circulate with the same quiet question: is this temporary — or is it something more permanent?
Answering that requires context — tidal science, historical experience and market evidence.
What causes king tides — and what they actually do here
King tides are astronomical events, not storms.
They occur when the sun, moon and Earth align during new or full moon phases. When that alignment coincides with the moon at perigee, its closest point to Earth, tidal range increases.
The result is a higher-than-average high tide and a lower-than-average low tide. These are known as perigean spring tides. We commonly call them king tides.
King tides represent the upper boundary of normal tidal behaviour. They show how high the ocean naturally reaches under clear-sky gravitational conditions.
They are fully predictable and calculated years in advance. They are not caused by rainfall, cyclones or low-pressure systems.
Based on 2026 tide data, the highest predicted king tides affecting the Margate/Redcliffe area, based on the Brisbane Bar reference station, are expected around:
Summer (daytime peaks):
• 25 December 2026 – approximately 10:29am
• 26 December 2026 – approximately 11:17am
• 4 January 2026 – approximately 10:15am
Winter (night peaks):
• 15 June 2026 – approximately 10:00pm
• 16 June 2026 – approximately 10:50pm
Summer king tides in this region typically peak during the day. Winter peaks often occur at night.
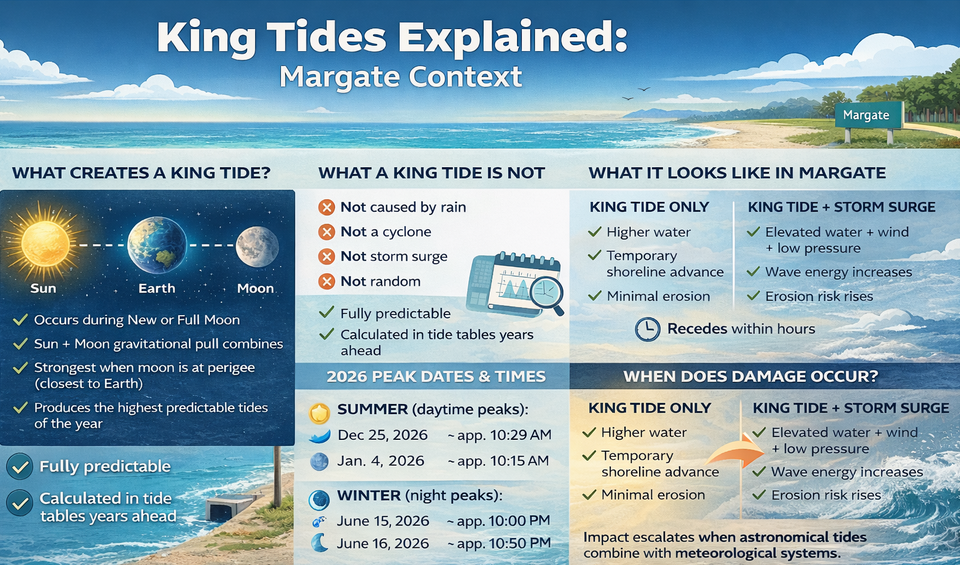
In Margate, this can mean:
• Temporary shoreline advance
• Narrower beach width
• Water reaching low foreshore parkland
• Minor pooling near drainage outlets along Margate Parade and toward Oxley Avenue
Within hours, levels recede.
King tides alone do not drive structural erosion. Significant coastal impact usually occurs when elevated astronomical tides coincide with storm surge and sustained onshore winds.
A king tide is gravitational. A storm surge is meteorological. Serious coastal damage typically requires both.
Historical context: 1974, the 1990s and 2011
For many long-term Peninsula residents, January 1974 remains the benchmark.
Cyclone Wanda produced heavy rainfall and storm surge across South East Queensland. On the Redcliffe Peninsula, elevated tides resulted in temporary inundation along foreshore areas, including sections near Margate Parade. Water overtopped low points before receding as tides shifted. Cleanup followed, but there was no permanent loss of residential streets.
In the 1990s, strong East Coast Low systems again generated elevated water levels when high tides aligned with sustained onshore winds.
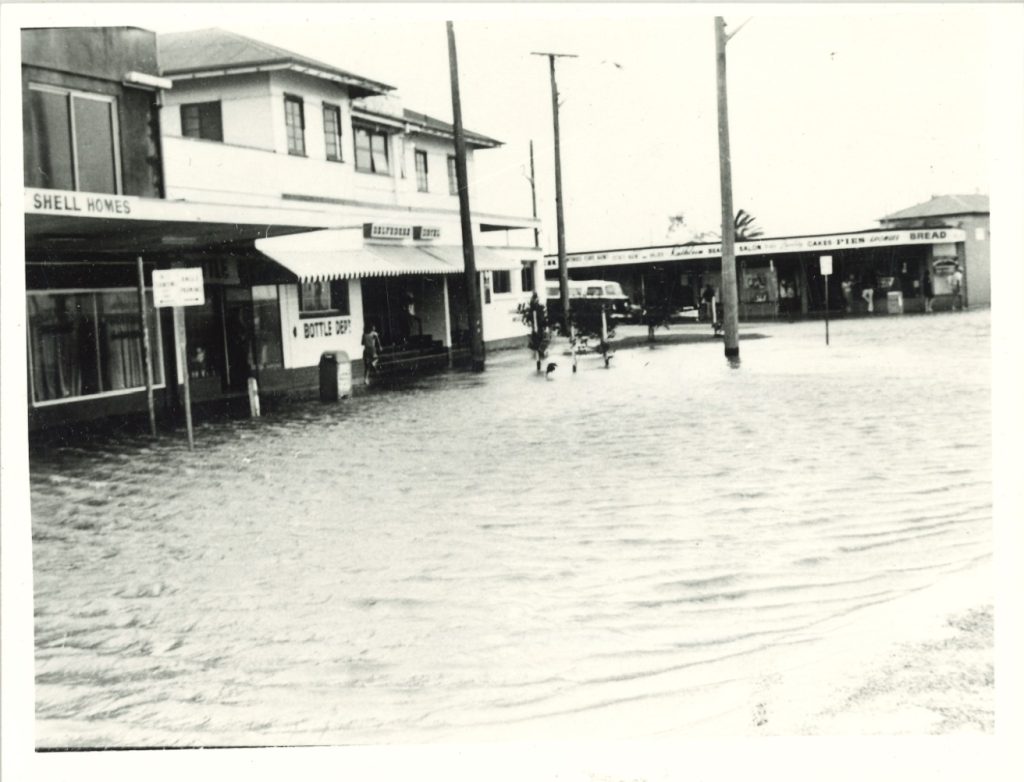
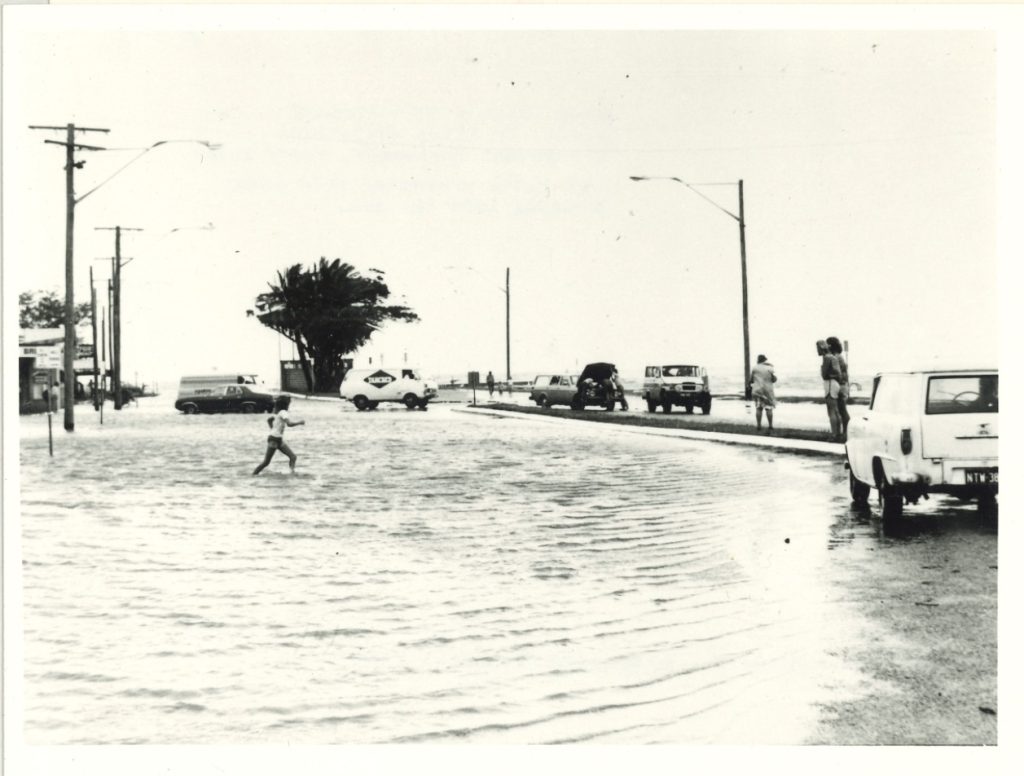
Flood waters during the 1974 cyclone, when king tides prevented rain water flowing into the drains. First photograph taken at the corner of Woodcliffe Crescent and Oxley Avenue (where Belvedere Hotel is) and the second photograph taken at the end of Oxley Avenue. Photo credit: SLQ collection
Residents of Woody Point near Ernest Street and areas feeding toward Oxley Avenue recall water reaching park edges and drainage outlets struggling to discharge against incoming tides. These were short-duration, weather-driven events.
Even during major inland flood events such as April 1990 — which produced record river heights across western Queensland — the Redcliffe Peninsula’s exposure profile remained coastal and storm-tide driven rather than riverine.
The January 2011 disaster, driven by prolonged rainfall associated with ex-Tropical Cyclone Tasha, is remembered primarily for river flooding inland.
Along the Peninsula, impacts were generally confined to temporary foreshore inundation and localised pooling in low-lying pockets where saturated drainage systems met elevated tides.
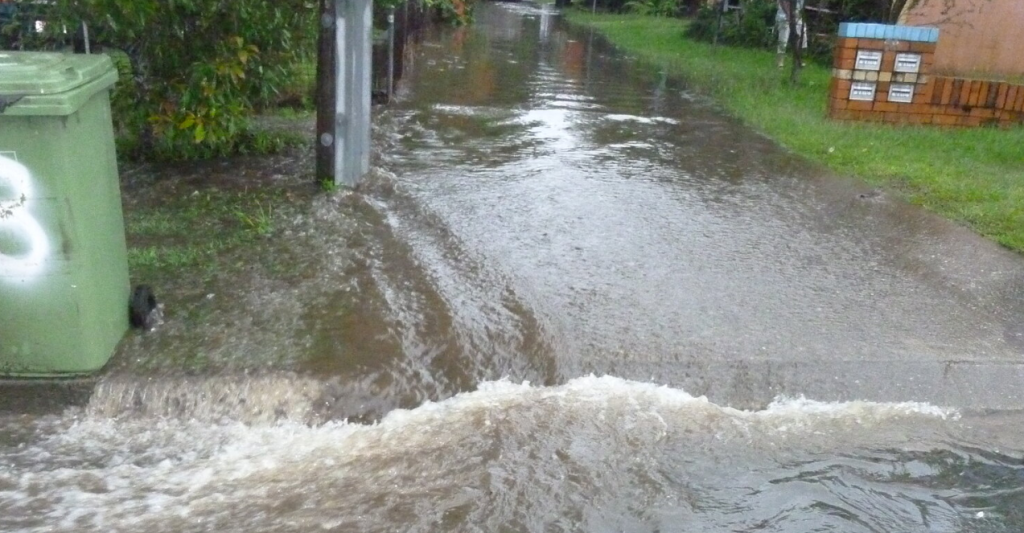
Photo Credit: Evans Family Collection, Moreton Bay Libraries/ MBPS-0044-248
Across these events, the pattern is consistent: episodic impacts tied to severe weather, not progressive coastline retreat.
What recent sales reveal
At the top end of the market, Natalie Wells sold 71 Margate Parade for $2,050,000 just before Christmas, looking across Margate Parade at the ocean with 3 Bedrooms and 2 Bathrooms on 407 square metres.
Meanwhile, Sheldon Pitama sold a 410 square metre block of land, further down at 105 Margate Parade, also in December, for $1,660,000.
Pitama, the Redcliffe Dolphins hooker who recently made his Maori All Stars debut (a team chock full of NRL players), also handled the sale of 14 Keenan Street off market, a 3 Bedroom house with 1 bathroom on a huge 810 square metre block for $1,300,000.
Here’s a rundown of recent sales:
• 3/5–7 Keenan Street, Margate — $750,000 — Sold on 11 Feb 2026
• 1&2/49a Robertson Avenue, Margate — $1,200,000 — Sold on 23 Jan 2026
• 2/5–7 Keenan Street, Margate — $742,000 — Sold on 15 Jan 2026
• 212 Oxley Avenue, Margate — $1,112,000 — Sold on 13 Jan 2026
• 58 Deans Street East, Margate — $957,500 — Sold on 23 Dec 2025
• 1 Kirkwood Street, Margate — $1,155,000 — Sold on 17 Dec 2025
• 16 Ernest Street, Margate — $1,740,000 — Sold on 16 Dec 2025
• 1/1 Cowen Street, Margate — $1,000,000 — Sold on 15 Dec 2025
• 71 Margate Parade, Margate — $2,050,000 — Sold on 12 Dec 2025
• 14 Keenan Street, Margate — $1,300,000 — Sold on 11 Dec 2025
Across these ten transactions, the median sale price is approximately $1.13 million.
The price structure shows clear segmentation rather than instability. Attached dwellings sit below $800,000. Inland detached homes cluster around $950,000 to $1.2 million. Waterfront and near-foreshore properties transact between $1.7 million and $2 million-plus.
71 Margate Parade at $2,050,000 confirms that absolute waterfront continues to command a strong premium. 16 Ernest Street at $1,740,000 reinforces confidence in proximity to the bay.
If coastal exposure were materially suppressing value, waterfront pricing would compress toward inland levels. That compression is not evident here.
Sea walls and engineered management
Margate’s foreshore is not unmanaged coastline. It forms part of a structured coastal management framework across the Redcliffe Peninsula.
Sections of the beachfront are protected by engineered rock revetments and seawalls designed to absorb wave energy and reduce erosion velocity during elevated tide and storm events. These structures protect underlying land and public assets from continual scouring.
Sea walls do not prevent water levels from rising during extreme events. They stabilise shoreline alignment and reduce erosion impact.
The suburb sits within Queensland’s coastal hazard mapping framework and the City of Moreton Bay’s shoreline management planning, including the Northern Moreton Bay Shoreline Erosion Management Plan and the Living Coast adaptation strategy. These incorporate storm tide modelling and sea level projections into development controls and long-term planning.
The coastline is monitored, engineered and regulated.
What this means for buyers
Waterfront property always carries exposure. The relevant question is whether that exposure is unmanaged — or understood.
Margate experiences predictable king tides and occasional storm-driven surge during severe weather. Historical events have resulted in temporary foreshore inundation, not sustained retreat of residential streets.
Recent sales demonstrate that waterfront addresses continue to attract measurable premiums. The market appears to price managed coastal exposure rather than discount it entirely.
Due diligence remains practical: review coastal hazard overlays, confirm elevation relative to sea level, understand drainage behaviour and check insurance requirements.
Coastal proximity carries risk. In Margate, that risk is mapped, engineered and incorporated into value.
Managed coastline, informed market
Margate’s coastal story is not one of denial or crisis.
It is a waterfront suburb within a semi-protected bay environment that experiences episodic weather events. Its shoreline is engineered. Its hazard areas are mapped.
And its property market continues to transact strongly.
The water rises. It recedes.
The premium for proximity remains.
Published 17 February 2026
