Stories

Insights & Local Market Commentary Click on any title to read the story

Bribie Island and the Pumicestone Passage

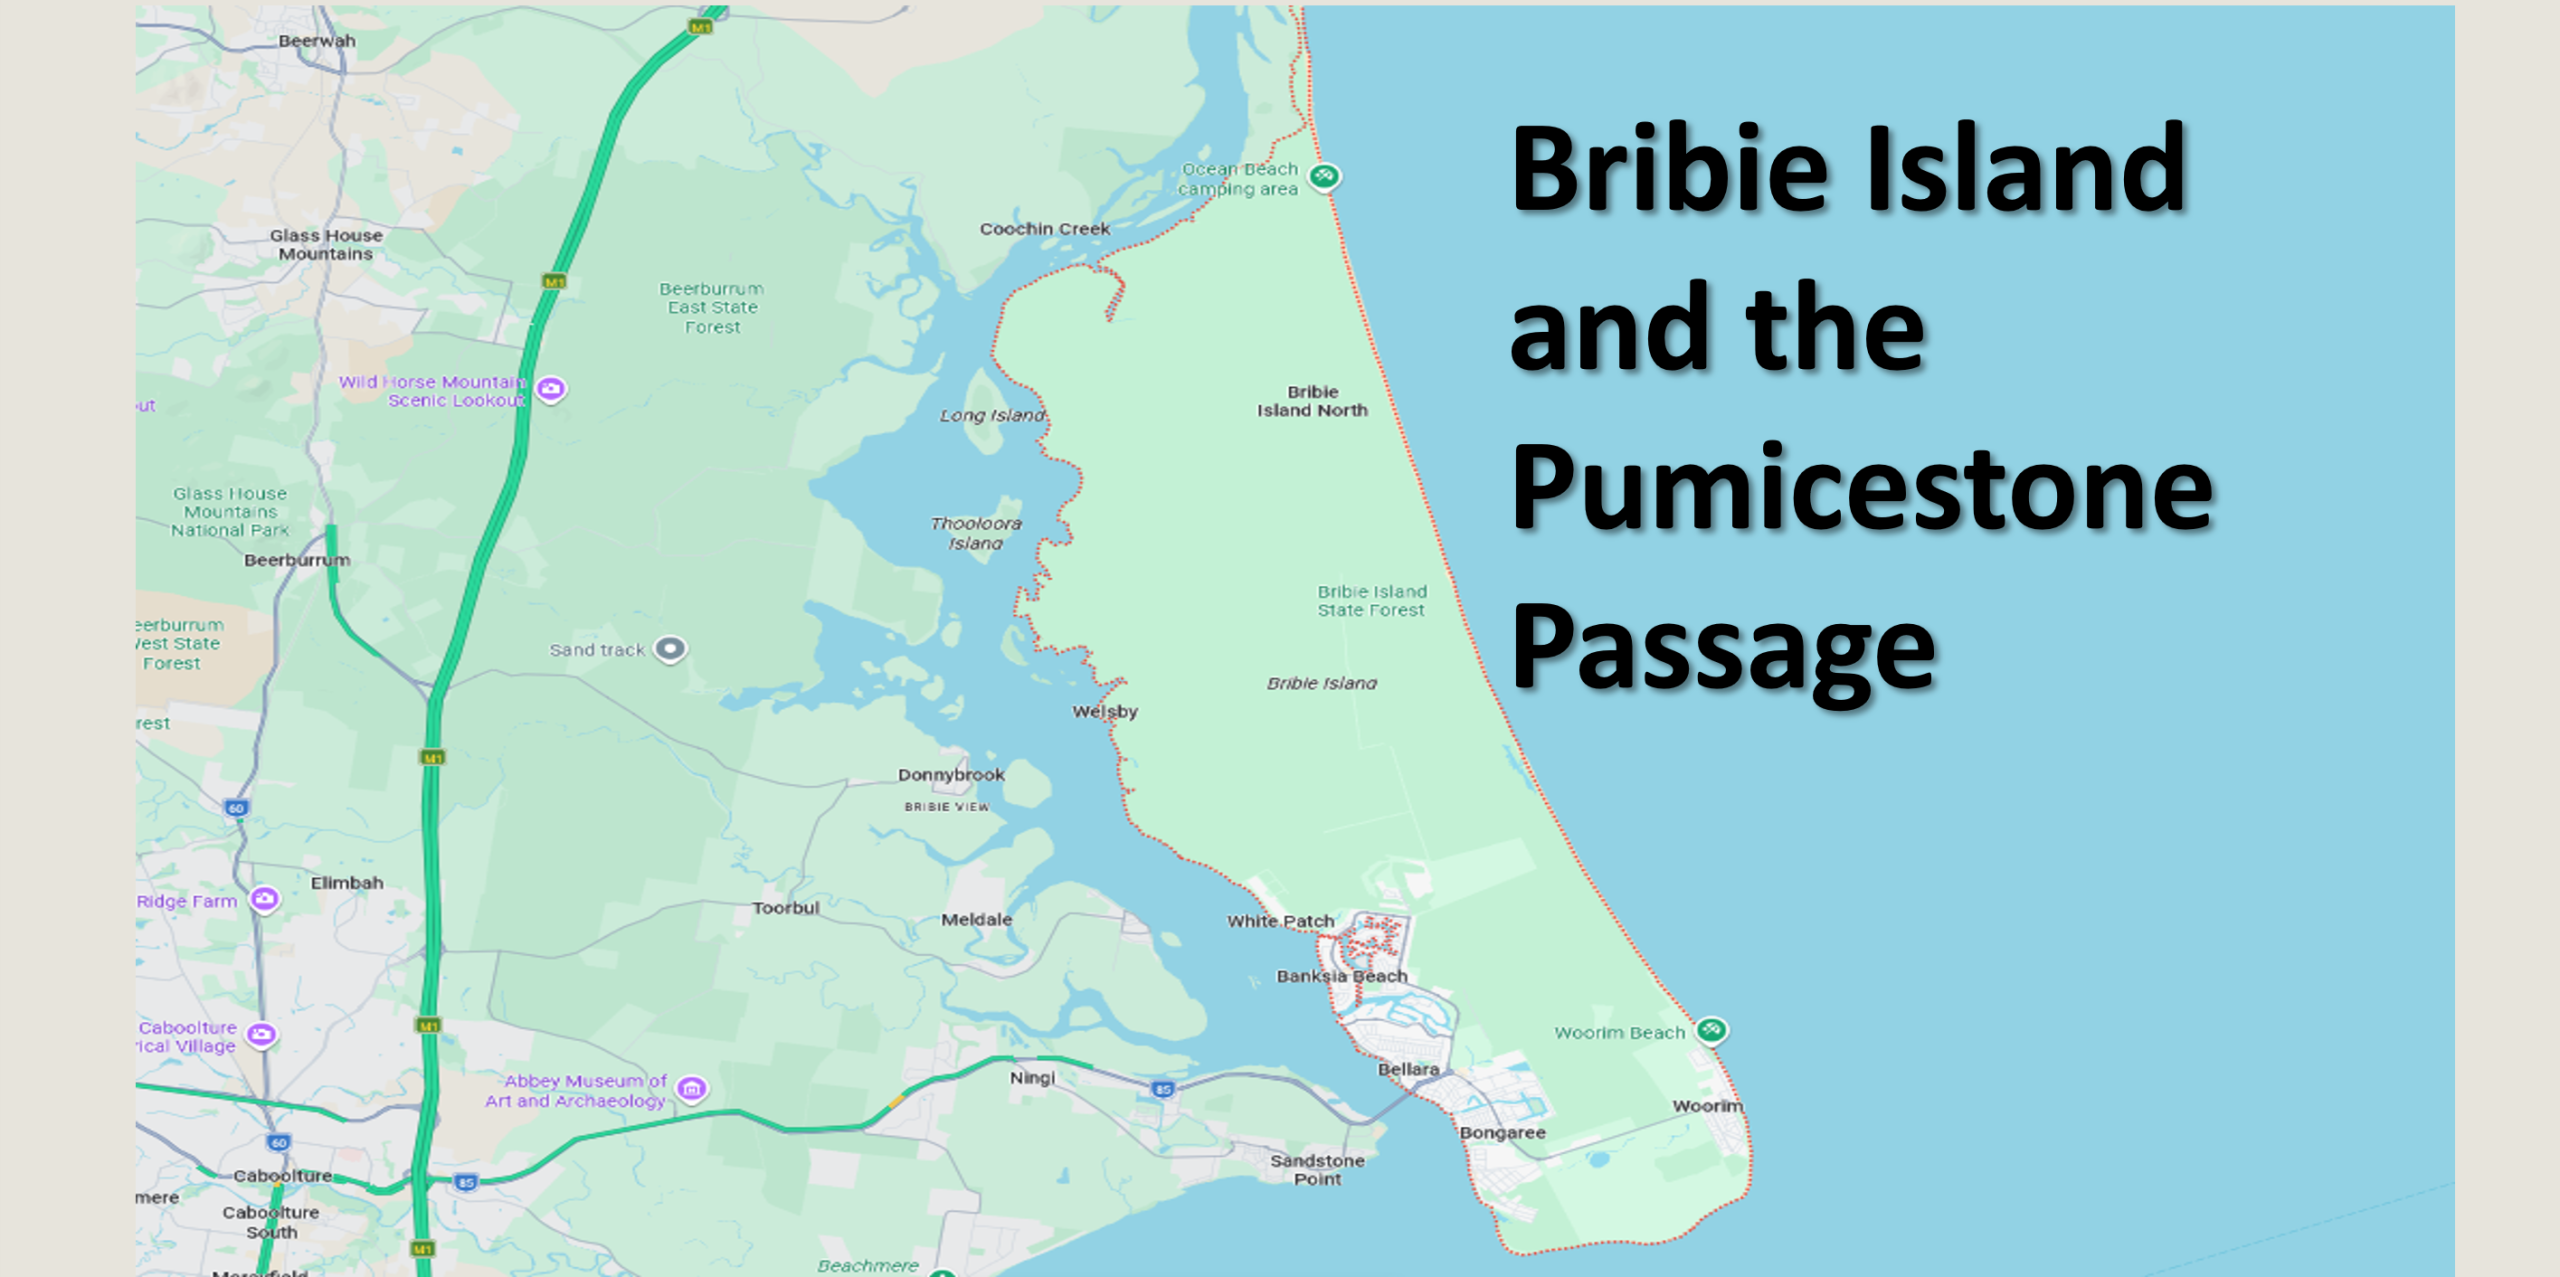
Property Market Overview for Bribie Island and the Pumicestone Passage

The Q1 2026 Market

The Bribie Island and Pumicestone Passage area is no longer a market that surprises people with its results — it’s one that demands to be taken seriously on its own terms.

Across six suburbs and 107 confirmed residential sales in the 90-day period, the combined median of $960,000 sits 9.1% above the 12-month benchmark. That figure alone tells a story of sustained buyer demand and diminishing supply.

But the more compelling story is in the individual suburb data, where the variance between the area’s most active and most premium markets reveals just how diverse — and how dynamic — this coastal corridor has become.

Ningi leads the region. A 90-day median of $1,195,000 running +29.9% above the annual benchmark, with 15 sales clearing in a median of just 13 days, makes Ningi the standout performer not just in this report but across every suburb covered in our entire Q1 2026 series.

The 4-bedroom house segment — 10 sales at a median of $1,197,500 — confirms this is not a statistical outlier. It is genuine market acceleration driven by buyers seeking large-lot lifestyle properties within reach of both the coast and the Bruce Highway corridor.

Banksia Beach anchors the premium end. A median of $1,330,000 — up 7.3% on the annual figure — and a top result of $2,650,000 at 48 Raptor Parade confirm that Banksia Beach is now firmly established as one of South East Queensland’s most sought-after coastal addresses.

The 50-day median days on market here is not a sign of weakness — it is a reflection of a considered buyer making a considered decision at a significant price point.

Bellara is the surprise. A +26.0% premium over the annual median is the strongest velocity reading of any Bribie Island suburb in this report, driven by a genuine shortage of quality stock meeting a pool of buyers who have been priced out of Banksia Beach and are discovering Bellara’s value proposition.

The 3-bedroom house median of $955,000 across 7 sales is the most reliable signal of a suburb repricing itself.

Bongaree remains the heartbeat of the island — the most active and most balanced market, with 35 confirmed sales across houses and units, a steady median of $850,000, and a diverse agent pool reflecting genuine competition for listings.

Woorim is Tim Moore’s market. Five of 12 sales in the period were handled by a single agent, with the 4-bedroom house segment running +22.5% above the annual benchmark.

The $1,600,000 result at 7 Blaik Street is a suburb record that tells vendors exactly what premium presentation and access to the right buyer database can deliver.

Sandstone Point offers the most accessible and balanced entry point across the corridor — a median of $925,000, sales spread from $673,000 to $1,365,000, and a genuinely competitive agent market that gives vendors real choice.

Taken together, the Bribie Island and Pumicestone Passage area presents a compelling case for any buyer, investor or vendor who has been watching from a distance.

The combination of lifestyle appeal, relative affordability compared to inner Brisbane, and demonstrably accelerating price growth in key segments makes this one of the more interesting markets in South East Queensland right now.

Bongaree · 4507 · Bribie Island

Bongaree Property Market Overview

Bongaree Property Market Overview · 24 January to 23 April 2026

$850,000
90-Day Median
$830,000
12-Month Median
18
Median Days on Market
+2.4%
Velocity vs 12M
01

Market at a Glance

180
12-Month Sales
Full year comparison base
$830,000
12-Month Median
All property types
18
Houses Sold (90 days)
House-led market
17
Units Sold (90 days)
Active unit market

Bongaree is Bribie Island’s most active and balanced market — 36 confirmed sales across houses and units, with both segments running ahead of the 12-month benchmark.

4Sold in ≤ 7 Days
Lightning fast
12Sold 7–30 Days
Brisk market
8Sold 30+ Days
Methodical pace
04

Top 10 Sales · Last 90 Days

#AddressTypeAgentSale Price
1
225 Welsby Pde
4BR HOUSEKristie BurleyClaire Uttley Realty$2,200,000
2
106 Kangaroo Ave
3BR HOUSEDavid WereszczukRE/MAX Advanced Bellara$1,600,000
3
34 Nulu St
3BR HOUSEShontelle CrossBelle Property Bribie Island$1,375,000
4
20 Flinders St
4BR HOUSESally GrantWilson & Co$1,270,000
5
1/57 Jacaranda Dr
3BR UNITSally GrantWilson & Co$1,250,000
6
10 Herring St
3BR HOUSEJulian EllisKnobel & Davis North$1,200,000
7
75 Kangaroo Ave
HOUSEKeith WilkinsKnobel & Davis$935,000
8
21 Paradise Pde
HOUSEKeith WilkinsKnobel & Davis$780,000
9
9 Wattle Ave
2BR HOUSEBryce HawkinsRay White Bribie Island$850,000
10
30/52 Bestman Ave
2BR UNITBrett & Debbie BoettcherFirst National Bribie Island$795,000
05

Agent Leaderboard · 90 Days

By Sales Count

Top 4 agents · 90-day period

1
BH
Bryce Hawkins
Ray White Bribie Island
5 sales
2
SG
Sally Grant
Wilson & Co Property
4 sales
3
JE
Julian Ellis
Knobel & Davis North
3 sales
3
KW
Keith Wilkins
Knobel & Davis North
3 sales
Market Concentration
Bongaree’s market is defined by its most active local performers. The top agents account for a meaningful share of transactions across the reporting period.
Vendor Insight

In a market where agent selection can influence buyer reach, local transaction depth remains an important consideration for vendors.

06

Market Summary

Bongaree is Bribie Island’s most active and balanced market with 36 confirmed sales across the 90-day period. The 90-day median of $850,000 sits +2.4% above the 12-month benchmark of $830,000. Both the house and unit markets are positive. The 3BR house segment recorded a median of $944,500 (+6.2%) across 12 sales, while the 2BR unit segment reached $695,000 (+8.3%) across 12 sales. The 4BR house segment reached $1,197,500 (+6.4%) across 4 sales. 2BR houses also outperformed at $811,500 (+5.0%). With a median of 18 days on market, Bongaree stock moves steadily. The suburb’s waterfront and canal-front offerings continue to attract strong buyer interest at the prestige end, evidenced by the $2,200,000 result at 225 Welsby Parade.
Bongaree Property Market Overview · 24 January to 23 April 2026

Published 29 April 2026

This overview is intended as a general market summary only and is provided for informational purposes. Nothing on this page constitutes financial, investment, legal or real estate advice. All figures, medians, rankings, and market observations are indicative only and should not be relied upon as complete or definitive. Property markets are dynamic and conditions can change rapidly — past performance is not a reliable indicator of future results. Readers should conduct their own independent research and seek qualified professional advice before making any property decision.

This overview is based on publicly available property transaction data for the period 24 January to 23 April 2026 and is presented in aggregated and derived form. Some transactions do not have a publicly available sale price — either because settlement has not yet been formally registered, or because the parties elected for the price to remain undisclosed. Where prices are unavailable, those transactions may be included in sales counts but are excluded from median and price band calculations. © 2026. All rights reserved.

Banksia Beach · 4507 · Bribie Island

Banksia Beach Property Market Overview

Banksia Beach Property Market Overview · 24 January to 23 April 2026

$1,355,000
90-Day Median
$1,242,500
12-Month Median
50
Median Days on Market
+9.1%
Velocity vs 12M
01

Market at a Glance

204
12-Month Sales
Full year comparison base
$1,242,500
12-Month Median
All property types
30
Houses Sold (90 days)
Premium house market
50 days
Median DOM
Most considered market

Banksia Beach is Bribie’s premium house market — all confirmed 90-day sales were houses, with a median of $1,355,000 and the suburb’s top result of $2,650,000 at 48 Raptor Parade.

1Sold in ≤ 7 Days
Lightning fast
7Sold 7–30 Days
Brisk market
18Sold 30+ Days
Methodical pace
04

Top 10 Sales · Last 90 Days

#AddressTypeAgentSale Price
1
48 Raptor Pde
4BR HOUSEElena StevensElena Stevens Real Estate$2,650,000
2
27 The Promontory
4BR HOUSEElena StevensElena Stevens Real Estate$2,250,000
3
10 Topsail Crct
4BR HOUSEElena StevensElena Stevens Real Estate$1,800,000
4
4 Vanillalily Cl
4BR HOUSEBryce HawkinsRay White Bribie Island$1,700,000
5
25 Voyagers Dr
4BR HOUSERoss Hincksman@realty  $1,750,000
6
80 Seaside Dr
4BR HOUSELeon & James RosenowSell Exclusive$1,750,000
7
18 Venus Crt
4BR HOUSELiam HawkinsRay White Bribie Island$1,465,000
8
1 Shearwater Cres
4BR HOUSELeon & James RosenowSell Exclusive$1,525,000
9
2 Turnstone Cl
4BR HOUSELeon & James RosenowSell Exclusive$1,575,000
10
41 Callisia Cres
4BR HOUSELeon & James RosenowSell Exclusive$1,400,000
05

Agent Leaderboard · 90 Days

By Sales Count

Top 5 agents · 90-day period

1
L&
Leon & James Rosenow
Sell Exclusive
8 sales
2
GH
George Hayes-Walsh
RE/MAX Advanced Bellara
4 sales
2
ES
Elena Stevens
Elena Stevens Real Estate
4 sales
4
SC
Shontelle Cross
Belle Property Bribie Island
2 sales
4
BH
Bryce Hawkins
Ray White Bribie Island
2 sales
Market Concentration
Banksia Beach’s market is defined by its most active local performers. The top agents account for a meaningful share of transactions across the reporting period.
Vendor Insight

In a market where agent selection can influence buyer reach, local transaction depth remains an important consideration for vendors.

06

Market Summary

Banksia Beach is the premium house market on Bribie Island. The 90-day median of $1,355,000 sits +9.1% above the 12-month benchmark of $1,242,500, with all confirmed sales in the period being houses. The 4BR house segment is the engine of the market — 20 sales in 90 days at a median of $1,390,000 (+4.5% vs 12M). The 3BR segment held near flat at $910,000. At the prestige end, 48 Raptor Parade achieved $2,650,000 and 27 The Promontory $2,250,000 — confirming genuine buyer depth above $2M. At 50 days median on market, Banksia Beach is the most considered of all six suburbs in this report. Buyers at this price point take their time — vendors should plan campaigns accordingly and select agents with the strongest buyer databases in this price corridor.
Banksia Beach Property Market Overview · 24 January to 23 April 2026

Published 29 April 2026

This overview is intended as a general market summary only and is provided for informational purposes. Nothing on this page constitutes financial, investment, legal or real estate advice. All figures, medians, rankings, and market observations are indicative only and should not be relied upon as complete or definitive. Property markets are dynamic and conditions can change rapidly — past performance is not a reliable indicator of future results. Readers should conduct their own independent research and seek qualified professional advice before making any property decision.

This overview is based on publicly available property transaction data for the period 24 January to 23 April 2026 and is presented in aggregated and derived form. Some transactions do not have a publicly available sale price — either because settlement has not yet been formally registered, or because the parties elected for the price to remain undisclosed. Where prices are unavailable, those transactions may be included in sales counts but are excluded from median and price band calculations. © 2026. All rights reserved.

Bellara · 4507 · Bribie Island

Bellara Property Market Overview

Bellara Property Market Overview · 24 January to 23 April 2026

$945,000
90-Day Median
$750,000
12-Month Median
30
Median Days on Market
+26.0%
Velocity vs 12M
01

Market at a Glance

81
12-Month Sales
Full year comparison base
$750,000
12-Month Median
All property types
9
Houses Sold (90 days)
House-led market
3
Units Sold (90 days)
Active unit market

Bellara’s 90-day median of $945,000 is +26.0% above the annual benchmark — the strongest velocity reading of any Bribie Island suburb. The 3BR house segment leads at +21.3%, backed by 7 sales.

1Sold in ≤ 7 Days
Lightning fast
4Sold 7–30 Days
Brisk market
5Sold 30+ Days
Methodical pace
04

Top 10 Sales · Last 90 Days

#AddressTypeAgentSale Price
1
12 Illoura Ave
4BR HOUSETracie RobinsonBribie Island Properties$1,210,000
2
54 Boronia Dr
4BR HOUSEShontelle CrossBelle Property Bribie IslandUndisclosed
3
1 Timari Ave
3BR HOUSESally GrantWilson & Co$1,005,000
4
11 Tripcony St
3BR HOUSEBryce HawkinsRay White Bribie Island$1,000,000
5
27 Tarooki St
4BR HOUSEJohn Farren-PriceLJ Hooker$985,000
6
82 Eucalypt St
3BR HOUSETroy KellyLJ Hooker Bribie Island$965,000
7
50 Arinya Ave
3BR HOUSETracie RobinsonBribie Island Properties$955,000
8
22 Tripcony St
3BR HOUSEBryce HawkinsRay White Bribie Island$935,000
9
18 Quail St
3BR HOUSEBryce HawkinsRay White Bribie Island$832,000
10
3/85 Sylvan Beach Esp
3BR UNITTroy KellyLJ Hooker Bribie Island$820,000
05

Agent Leaderboard · 90 Days

By Sales Count

Top 3 agents · 90-day period

1
BH
Bryce Hawkins
Ray White Bribie Island
4 sales
2
TK
Troy Kelly
LJ Hooker Bribie Island
3 sales
3
TR
Tracie Robinson
Bribie Island Properties
2 sales
Market Concentration
Bellara’s market is defined by its most active local performers. The top agents account for a meaningful share of transactions across the reporting period.
Vendor Insight

In a market where agent selection can influence buyer reach, local transaction depth remains an important consideration for vendors.

06

Market Summary

Bellara is recording its strongest 90-day velocity in this report cycle. A median of $945,000 — +26.0% above the 12-month benchmark of $750,000 — reflects genuine price movement, with 14 total sales in the period. The 3BR house segment is the most reliable indicator, with 7 sales at a median of $955,000 (+21.3%). The 4BR segment reached $1,097,500 (+18.0%) across 2 sales. At the unit end, all three bedrooms configurations recorded positive or near-flat results against the annual median. With a median of 30 days on market and a small but active agent pool, Bellara rewards vendors who select practitioners with demonstrated local transaction depth.
Bellara Property Market Overview · 24 January to 23 April 2026

Published 29 April 2026

This overview is intended as a general market summary only and is provided for informational purposes. Nothing on this page constitutes financial, investment, legal or real estate advice. All figures, medians, rankings, and market observations are indicative only and should not be relied upon as complete or definitive. Property markets are dynamic and conditions can change rapidly — past performance is not a reliable indicator of future results. Readers should conduct their own independent research and seek qualified professional advice before making any property decision.

This overview is based on publicly available property transaction data for the period 24 January to 23 April 2026 and is presented in aggregated and derived form. Some transactions do not have a publicly available sale price — either because settlement has not yet been formally registered, or because the parties elected for the price to remain undisclosed. Where prices are unavailable, those transactions may be included in sales counts but are excluded from median and price band calculations. © 2026. All rights reserved.

Woorim · 4507 · Bribie Island

Woorim Property Market Overview

Woorim Property Market Overview · 24 January to 23 April 2026

$929,000
90-Day Median
$890,000
12-Month Median
32
Median Days on Market
+4.4%
Velocity vs 12M
01

Market at a Glance

64
12-Month Sales
Full year comparison base
$890,000
12-Month Median
All property types
15
Sales (90 days)
Confirmed transactions
33%
Top Agent Share
Tim Moore dominates

Woorim’s market is dominated by one agent — Tim Moore accounted for 5 of 15 confirmed sales. The 4BR house segment leads at +22.5% above the annual median.

1Sold in ≤ 7 Days
Lightning fast
4Sold 7–30 Days
Brisk market
6Sold 30+ Days
Methodical pace
04

Top 10 Sales · Last 90 Days

#AddressTypeAgentSale Price
1
7 Blaik St
4BR HOUSEJohn Farren-PriceLJ Hooker$1,600,000
2
37 Clement St
4BR HOUSETim MooreClaire Uttley Realty$1,590,000
3
85 Fairway Ave
3BR HOUSETim MooreClaire Uttley RealtyUndisclosed
4
79 Arcadia Ave
4BR HOUSETim MooreClaire Uttley Realty$1,350,000
5
3 Longland Crt
4BR HOUSETim MooreClaire Uttley Realty$1,330,000
6
2/3-9 North St
2BR UNITTim MooreClaire Uttley Realty$890,000
7
22 Brookes Cres
3BR HOUSERodney EganRay White Bribie Island$1,004,600
8
4/1 Links Crt
3BR HOUSEAndrew HillBribie Island Real Estate$740,000
9
3/74 North St
3BR UNITSimon LastSell Exclusive$775,000
10
2/7 Gull St
2BR UNITSimon LastSell Exclusive$640,000
05

Agent Leaderboard · 90 Days

By Sales Count

Top 2 agents · 90-day period

1
TM
Tim Moore
Claire Uttley Realty
5 sales
2
KW
Keith Wilkins
Knobel & Davis North
2 sales
Market Concentration
Woorim’s market is defined by its most active local performers. The top agents account for a meaningful share of transactions across the reporting period.
Vendor Insight

In a market where agent selection can influence buyer reach, local transaction depth remains an important consideration for vendors.

06

Market Summary

Woorim is showing strong upward momentum. The 90-day median of $929,000 sits +4.4% above the 12-month benchmark of $890,000, with the 4BR house segment the standout performer at a median of $1,470,000 (+22.5%). The suburb’s market is defined by one practitioner — Tim Moore of Claire Uttley Realty accounted for 5 of 15 confirmed sales, including 4 of the top 5 results. This level of market concentration is significant for vendors: Tim Moore’s buyer database and local knowledge represent an unmatched resource in this market. The 3BR segment tracked near flat at $997,300, while units (2BR and 3BR) were slightly softer than the annual median. At 32 days median on market, Woorim sits in the middle of the range across the six suburbs.
Woorim Property Market Overview · 24 January to 23 April 2026

Published 29 April 2026

This overview is intended as a general market summary only and is provided for informational purposes. Nothing on this page constitutes financial, investment, legal or real estate advice. All figures, medians, rankings, and market observations are indicative only and should not be relied upon as complete or definitive. Property markets are dynamic and conditions can change rapidly — past performance is not a reliable indicator of future results. Readers should conduct their own independent research and seek qualified professional advice before making any property decision.

This overview is based on publicly available property transaction data for the period 24 January to 23 April 2026 and is presented in aggregated and derived form. Some transactions do not have a publicly available sale price — either because settlement has not yet been formally registered, or because the parties elected for the price to remain undisclosed. Where prices are unavailable, those transactions may be included in sales counts but are excluded from median and price band calculations. © 2026. All rights reserved.

Sandstone Point · 4511 · Pumicestone Passage

Sandstone Point Property Market Overview

Sandstone Point Property Market Overview · 24 January to 23 April 2026

$917,500
90-Day Median
$880,000
12-Month Median
20
Median Days on Market
+4.3%
Velocity vs 12M
01

Market at a Glance

100
12-Month Sales
Full year comparison base
$880,000
12-Month Median
All property types
16
Houses Sold (90 days)
House-dominant market
7
Units Sold (90 days)
Active unit market

Sandstone Point offers the area’s most balanced price range — from $673,000 units through to $1,365,000 houses, with steady positive movement across the 3BR and 4BR house segments.

3Sold in ≤ 7 Days
Lightning fast
7Sold 7–30 Days
Brisk market
6Sold 30+ Days
Methodical pace
04

Top 10 Sales · Last 90 Days

#AddressTypeAgentSale Price
1
20 Bondi Ct
4BR HOUSESimon LastSell Exclusive$1,365,000
2
12 Smout Ct
5BR HOUSEGeoff MartinLJ Hooker Bribie Island$1,340,000
3
11 Chiltern Pl
4BR HOUSELeon & James RosenowSell Exclusive$1,050,000
4
10 Clovelly Pl
4BR HOUSEKaren, Ellie & Chloe PetersStandout Property$975,000
5
6 Queenscliff Ct
4BR HOUSEKaren, Ellie & Chloe PetersStandout Property$970,000
6
4 Queenscliffe Ct
4BR HOUSEKaren, Ellie & Chloe PetersStandout Property$970,000
7
116 Carpenter Way
4BR HOUSEKristy FraserRay White Bribie Island$975,000
8
19 Trent Ct
4BR HOUSEKaren, Ellie & Chloe PetersStandout Property$932,000
9
5 Biggera Ct
4BR HOUSEKaren, Ellie & Chloe PetersStandout Property$870,000
10
2 Seafarer Crt
HOUSEVictoria Nicholson & Tarek Noble  $765,000
05

Agent Leaderboard · 90 Days

By Sales Count

Top 4 agents · 90-day period

1
KE
Karen, Ellie & Chloe Peters
Standout Property
4 sales
2
BH
Bryce Hawkins
Ray White Bribie Island
3 sales
3
KF
Kristy Fraser
Ray White Bribie Island
2 sales
3
SL
Simon Last
Sell Exclusive
2 sales
Market Concentration
Sandstone Point’s market is defined by its most active local performers. The top agents account for a meaningful share of transactions across the reporting period.
Vendor Insight

In a market where agent selection can influence buyer reach, local transaction depth remains an important consideration for vendors.

06

Market Summary

Sandstone Point is the most balanced and diversified market in this report. The 90-day median of $917,500 sits +4.3% above the 12-month benchmark of $880,000, with sales ranging from $673,000 entry-level units through to $1,365,000 premium houses. The 4BR house segment — the most liquid with 11 sales at $950,000 (+3.3%) — provides the most reliable comparable evidence. The 3BR house segment also outperformed at $925,000 (+6.0% across 4 sales). The 5BR segment improved to $1,260,000 (+6.8% across 2 sales). The unit market was slightly softer than the annual median. With 20 days median on market and a genuinely competitive agent pool, Sandstone Point offers vendors real choice and buyers a well-supplied market across multiple price points.
Sandstone Point Property Market Overview · 24 January to 23 April 2026

Published 29 April 2026

This overview is intended as a general market summary only and is provided for informational purposes. Nothing on this page constitutes financial, investment, legal or real estate advice. All figures, medians, rankings, and market observations are indicative only and should not be relied upon as complete or definitive. Property markets are dynamic and conditions can change rapidly — past performance is not a reliable indicator of future results. Readers should conduct their own independent research and seek qualified professional advice before making any property decision.

This overview is based on publicly available property transaction data for the period 24 January to 23 April 2026 and is presented in aggregated and derived form. Some transactions do not have a publicly available sale price — either because settlement has not yet been formally registered, or because the parties elected for the price to remain undisclosed. Where prices are unavailable, those transactions may be included in sales counts but are excluded from median and price band calculations. © 2026. All rights reserved.

Ningi · 4511 · Pumicestone Passage Hinterland

Ningi Property Market Overview

Ningi Property Market Overview · 24 January to 23 April 2026

$1,155,000
90-Day Median
$920,000
12-Month Median
13
Median Days on Market
+25.5%
Velocity vs 12M
01

Market at a Glance

115
12-Month Sales
Full year comparison base
$920,000
12-Month Median
All property types
15
Houses Sold (90 days)
Exclusively house market
13 days
Fastest DOM
Fastest of 6 suburbs

Ningi is the standout performer across the entire report area — a 90-day median of $1,155,000 sits +25.5% above the 12-month benchmark, with a median of just 13 days on market.

3Sold in ≤ 7 Days
Lightning fast
7Sold 7–30 Days
Brisk market
2Sold 30+ Days
Methodical pace
04

Top 10 Sales · Last 90 Days

#AddressTypeAgentSale Price
1
13-15 Mecklem Ct
5BR HOUSEMelissa BrookerPlace Purpose Group$1,825,000
2
45 Cavanagh Pl
6BR HOUSEAdam CharltonMovement Realty$1,820,000
3
41 Wrenaus Way
4BR HOUSEDavid DillonHarcourts Pinnacle$1,375,000
4
65-69 Fauna Way
4BR HOUSEBianca McCannIconic Realty Group$1,300,000
5
8-10 Flaxton Ct
4BR HOUSEAngela Le FevrePlace Purpose Group$1,275,000
6
12-14 Greygum Ct
4BR HOUSEDavid DillonHarcourts Pinnacle$1,115,000
7
18 Grasstree Pl
4BR HOUSEDavid DillonHarcourts Pinnacle$1,100,000
8
30 Gecko Pl
3BR HOUSEBryce HawkinsRay White Bribie Island$1,100,000
9
30 Lakeside Cres
3BR HOUSETroy KellyLJ Hooker Bribie Island$990,000
10
73/15-23 Redondo St
3BR HOUSETatjana Freeman & Maddie SeeImage Property$765,000
05

Agent Leaderboard · 90 Days

By Sales Count

Lead agent · 90-day period

1
DD
David Dillon
Harcourts Pinnacle
3 sales
06

Market Summary

Ningi is the standout performer across the entire Bribie Island and Pumicestone Passage report area. The 90-day median of $1,155,000 sits +25.5% above the 12-month benchmark of $920,000 — the strongest positive velocity reading of all six suburbs. The 4BR house segment is the most statistically reliable, with 10 sales at a median of $1,197,500 (+21.1% vs 12M). The 3BR segment also outperformed at $920,000 (+12.9% across 3 sales). At 13 days median on market, Ningi is the fastest-moving suburb in this report by a considerable margin. Ningi’s appeal as a larger-lot, hinterland lifestyle option within reach of Bribie Island continues to drive genuine buyer competition. Well-priced properties here are meeting ready buyers quickly.
Ningi Property Market Overview · 24 January to 23 April 2026

Published 29 April 2026

This overview is intended as a general market summary only and is provided for informational purposes. Nothing on this page constitutes financial, investment, legal or real estate advice. All figures, medians, rankings, and market observations are indicative only and should not be relied upon as complete or definitive. Property markets are dynamic and conditions can change rapidly — past performance is not a reliable indicator of future results. Readers should conduct their own independent research and seek qualified professional advice before making any property decision.

This overview is based on publicly available property transaction data for the period 24 January to 23 April 2026 and is presented in aggregated and derived form. Some transactions do not have a publicly available sale price — either because settlement has not yet been formally registered, or because the parties elected for the price to remain undisclosed. Where prices are unavailable, those transactions may be included in sales counts but are excluded from median and price band calculations. © 2026. All rights reserved.